SPECT Imaging
What is a SPECT Scan?
SPECT is an acronym for Single Photon Emission Computed Tomography. It is a CT-like technology applied to nuclear medicine that measures brain blood flow. With measurement of blood flow it becomes an indirect measure of brain function that can be used to study any brain disease, including decompression illness, trauma, stroke, carbon monoxide, cerebral palsy, near-drowning, multiple sclerosis, etc. SPECT brain imaging began nearly 40 years ago and has been available to physicians clinically ever since. Its usage is storied primarily because of limitations of the technology. Through the late 1980’s scanners were equipped with a single head or camera that prevented radiologists’ appreciation of lesions smaller than a golfball. For this reason and the very small images rendered on x-ray film the medical community disparaged nuclear medicine and this modality as “unclear” medicine. In the late 1980’s, however, a technological “revolution” occurred when two or three camera heads were placed on scanners, allowing resolution of pea-sized brain lesions. A vast world of brain pathology was now accessible with the new high-resolution scanners.
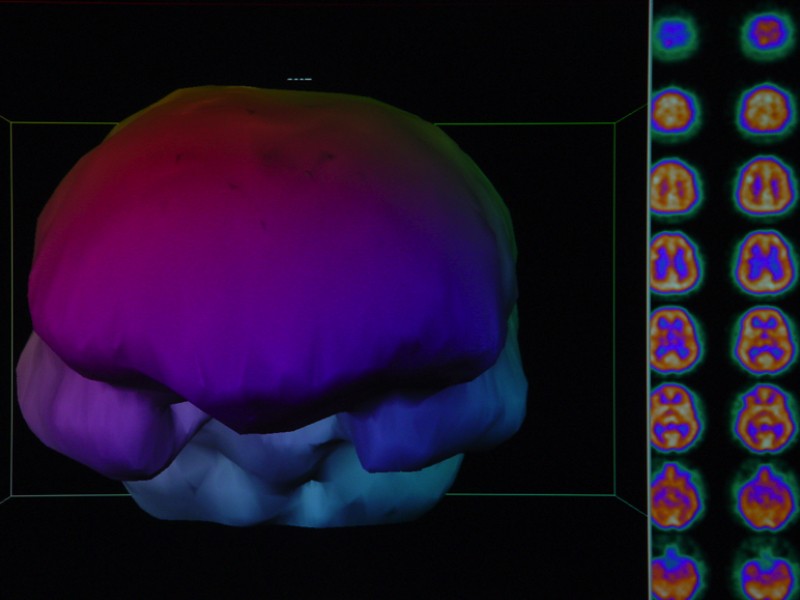
A Normal SPECT brain blood flow scan:
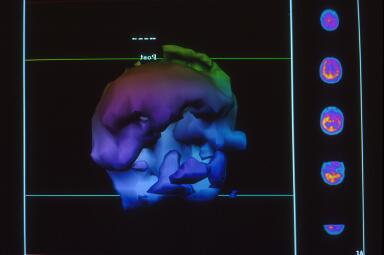
This is a three-dimensional surface reconstruction of the typical “slices” of a SPECT scan. It shows blood flow on the surface of the brain. In this image, you are looking straight at the person’s face. The large, broad area in the front of the picture, behind the forehead, is the area where the frontal lobes are located. The two oblong-shaped objects below the frontal lobes are the temporal lobes. The patient’s ears would be just outside the temporal lobes and the eyes would be right in front of the temporal lobes and a little toward the middle of the image. On the righthand side of this picture are some of the transverse slices (slices that would sit like a stack of plates from the top of the head to the bottom of the image).
In a normal person, there is very little color variation in the slices. The slices should appear to have a smooth texture. That translates to a smooth-looking surface of the brain and the three-dimensional image. When there are areas of injury (or decreased blood flow), the slices are irregular and show a variety of colors. That translates to a rough/coarse surface to the 3-dimensional image.
Note: A SPECT scan is often performed before HBOT and again after one HBOT to display recoverable brain tissue. In order for the increased blood flow to be more permanent, at least approximately 40 treatments are then completed.
What does a SPECT Scan show?
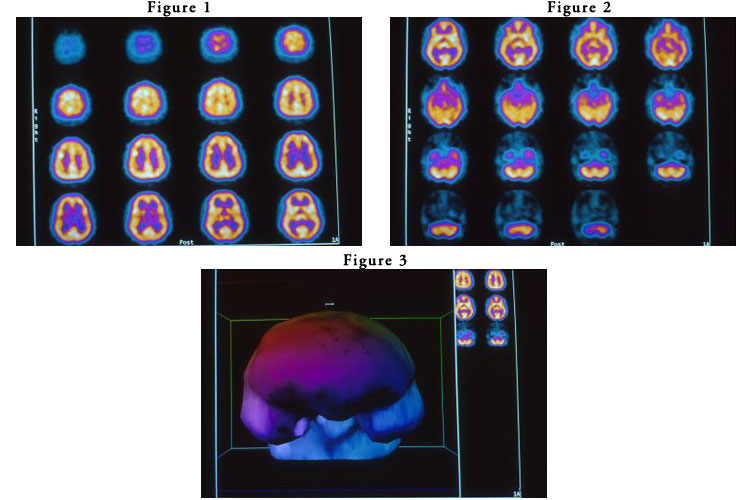
Dr. Harch was fortunate enough to have Picker International’s second triple-head scanner placed in the nuclear medicine department at West Jefferson Medical Center in Marrero, Louisiana. It was the imaging of the second diver above (1), who had been negatively scanned on a single-head scanner, that opened the world of discovery for Dr. Harch of HBOT in chronic brain injury. An example of this dramatic improvement in resolution on the new scanners is shown in the following pictures: Figure 1 is a SPECT scan of a 19 yr. old male who fell out of a car at 65 mph on the interstate, landing on his left forehead. The scan images are transverse orientation (like layers), the actual size they appear on the x-ray film, and are in gray scale with 60 shades of increasing darkness from clear (no blood flow) to black (normal blood flow). Images start at the base of the brain in the upper left corner and proceed to the top of the brain in the lower right corner. Your right is the patient’s left. The scan was performed on the third hospital day and after three hyperbaric oxygen treatments. The patient is comatose on a ventilator. His case is presented in detail as Case 1, Chapter 18 by Drs. Harch and Neubauer, K.K. Jain Textbook of Hyperbaric Medicine, 7/99. The scan was read as normal by a board certified radiologist.
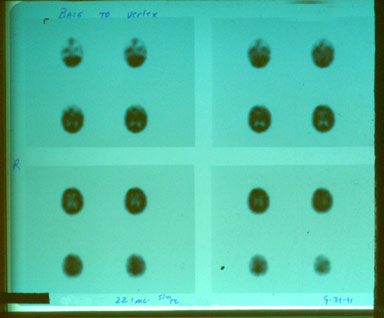
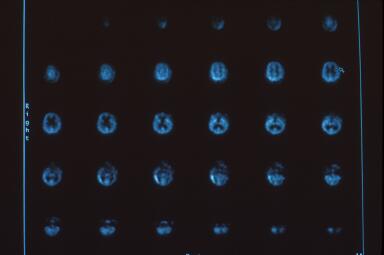
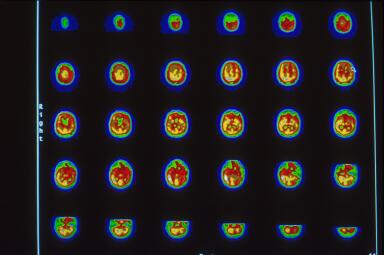
Due to his medical instability Dr. Harch was unable to transport him to the high resolution scanner used for the images in Figure 2 and elsewhere on this website. Dr. Harch reasoned that it was a physiological impossibility for an individual in coma to have normal brain blood flow. HBOT was continued until the patient was transportable three weeks later to the high resolution triple-head camera at West Jefferson Medical Center. That scan is registered in Figure 2 on gray scale (60 shades of gray which correspond to 60 grades of blood flow from the highest, white, to the lowest, black). Images are again transverse, but with the opposite registration: left upper hand corner is the top of the brain and proceeds to the base of the brain in the right lower corner. The patient was clinically much better, awake, responding to commands, but still on a ventilator. The brain scan showed a heterogenous pattern of flow, a significant reduction in left frontal brain blood flow at the point of impact of the patient’s head with the asphalt (arrow at 6th image, 2nd row), and a pathological increase in the direct opposite “contra coup” rear of the brain, luxury perfusion (4th row, images 2-5; this area subsequently dies). Figure 3 is a 10-step color map of Figure 2 that clearly shows the reduction (red) in blood flow at the arrow and the increase (white) on the opposite side of the brain on 10-step color scale (each color is a 10% reduction in brain blood flow going from the highest, white, to gray, sand, khaki, crimson, wine, green, green/blue, light blue, dark blue). Three dimensional surface reconstruction of Figures 2 and 3 is seen in Figure 4 and the multiple defects in brain blood flow are now readily apparent. The image is the patient’s brain looking directly at you. Notice the large defect in the left front of the patient’s brain. The small “cap” over the left rear of the patient’s brain is increased scalp and skull blood flow where the head hit the pavement.
Click here for comparative analysis of above
Using Dr. Neubauer’s approach of scan, dive, rescan featured in his “Idling Neuron” letter to Lancet (21), Drs. Harch, Gottlieb, Van Meter, and Staab began investigating a large number of patients with chronic brain injury in the Perfusion/Metabolism Encephalopathies Study, following initial treatment of a variety of the above chronic brain injured divers and trauma patients. Many of these patients and their scans have been presented at UHMS and other meetings and featured in the K.K. Jain Textbook of Hyperbaric Medicine, Second and Third Editions, 1996 and 1999. The scanning also formed the basis for the Galveston Chronic Traumatic Brain Injury Study which was initiated, formulated, and directed by Dr. Harch. SPECT brain imaging is a powerful tool that when properly applied can argue single case causality for the efficacy of HBOT in chronic brain injury.
One of the greatest controversies in SPECT brain imaging is the question: what is a normal brain? A neurologically “normal” person who has no symptoms or complaints can be a person who has never smoked, abused alcohol, or had a head injury or a person who has smoked for 30 years or a person who has “fully” recovered from a head injury and loss of consciousness. While all three patients are “normal” the SPECT brain scans will be very “normal” on the first individual and less “normal” and possibly abnormal on the other two, according to who reads the scans and how many “normal” individuals’ brain scans the reader has seen in his/her career. Without knowledge of such personal information the interpretation of the scan is difficult. The lack of an atlas of normal patients at any given SPECT facility has plagued accurate interpretation of scans for all but those scans showing large focal deficits such as in stroke. For diffuse neuropathologies that are registered by a heterogenous scan pattern the problem is particularly vexing. As a result, it becomes critically important for anyone performing SPECT brain imaging on a high-resolution scanner to have scanned a group of neurologically well characterized “normals”. (On a low resolution scanner this is less important due to volume averaging effects that tend to smooth small focal variations in brain blood flow). Over the course of the past 10 years Dr. Harch has recruited, performed detailed neurological histories, and scanned over 75 normal individuals on a triple-head Picker scanner. This is one of the largest and best characterized groups of normal SPECT brain individuals in the United States and possibly internationally. Comparison to these normals and evaluation of a patient’s response and change in SPECT brain scan after HBOT allows a greater appreciation of abnormalities in patients. Examples of these individuals and concepts are as follows:
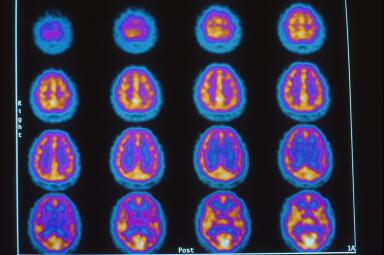
SPECT Scan of a Normal Brain Case 1:
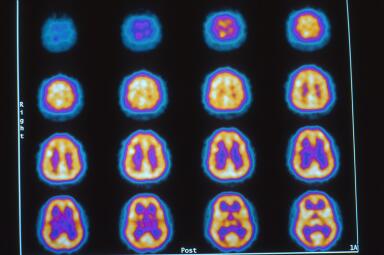
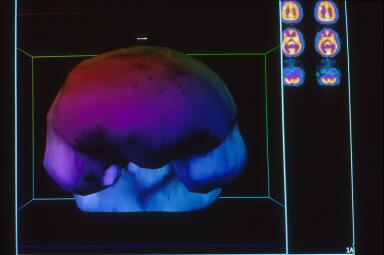
This is a 37 year old Black male friend of Dr. Harch who has never drank alcohol, used tobacco or drugs, or had any type of brain injury. The images, Figures 1 and 2 are in the transverse plane and proceed from the top of the brain to the base of the brain from the upper left to lower right of the picture. The orientation of each image is as described above in Figures 2 and 3 of the 19 year old patient. The color map is white, yellow, orange, purple, blue, black from highest to lowest brain blood flow. The scan is performed at rest and shows high brain blood flow (yellow) with a homogenous smooth pattern. Three dimensional surface reconstruction is in Figure 3. Compare this to another “normal”, case 2.
Click here for comparative analysis of above
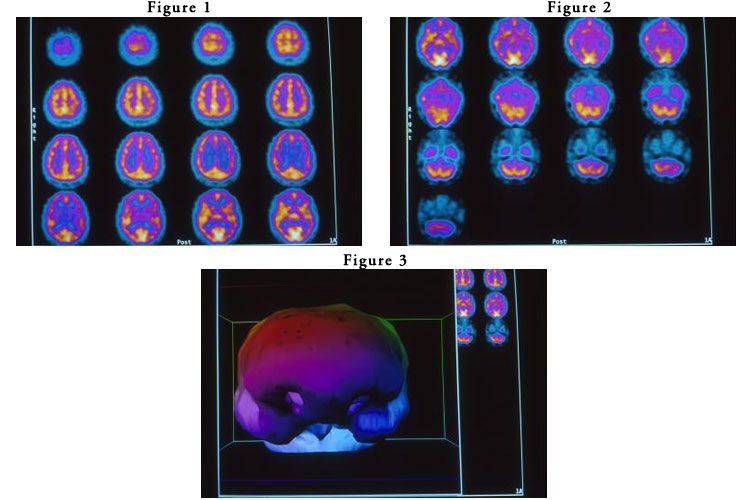
SPECT Scan of a Normal Brain Case 2:
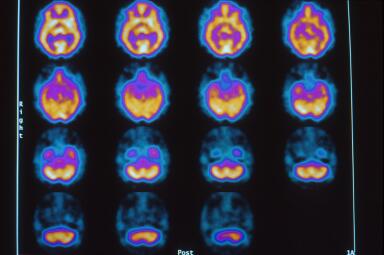
This is a 44 year old asymptomatic Black male who occasionally drinks alcohol and smokes a cigar and who has had at least three episodes of loss of consciousness. Figures 1 and 2 show a diffuse heterogenous pattern and overall reduction in brain blood flow (orange-purple colors). This scan may be “normal” to a reader without the benefit of case 1 and the detailed knowledge of three episodes of loss of consciousness, but is distinctly abnormal compared to case 1. Figure 3 is the three dimensional reconstruction of Figures 1 and 2 that only captures the inferior frontal lobe defects.


Click here for comparative analysis of above
Click here to compare “Normal” Case 1 to “Normal Case 2
1. Harch PG, et al. SPECT brain imaging in the diagnosis and treatment of type II decompression sickness. Undersea and Hyperbaric Medicine, 1992;19(Suppl):42.
21. Neubauer RA, et al. Enhancing “idling” neurons. Lancet, 1990;335:542.
26. Harch PG, et al. HMPAO SPECT brain imaging of acute CO poisoning and delayed neuropsychological sequelae (DNSS). Undersea and Hyperbaric Medicine, 1994;21(Suppl):15.